It started with an email. An internship opportunity, to which Nikita Shtarkman, while attending his junior year of university, applied. He met Brice Ménard at the interview stage, who explained the project at hand. It quickly became clear that this would not be a regular internship. And, indeed, it wasn’t. Instead, it was the beginning of a project as beautiful as it is ambitious.
“The map of the observable Universe” is a collaboration between designer and programmer Nikita Shtarkman and astrophysics professor Brice Ménard. Nikita, who has a B.S. in Computer Science from Johns Hopkins University, is now pursuing an MFA in Design & Technology at Parsons School of Design. He describes his practice as following his curiosity, which is, perhaps, the impetus that drove him to pursue this fateful internship with Brice.
Indeed, there does seem to be something inherently interesting about ineffable vastness, about the mysteries of the Universe. This has also been a guiding force behind Brice Ménard’s fascination with astronomy, which he is able to trace all the back to his childhood. As a child, he tells us, he was fascinated by pictures of deep space for both their beauty and the questions that arise about these mysterious distant worlds.
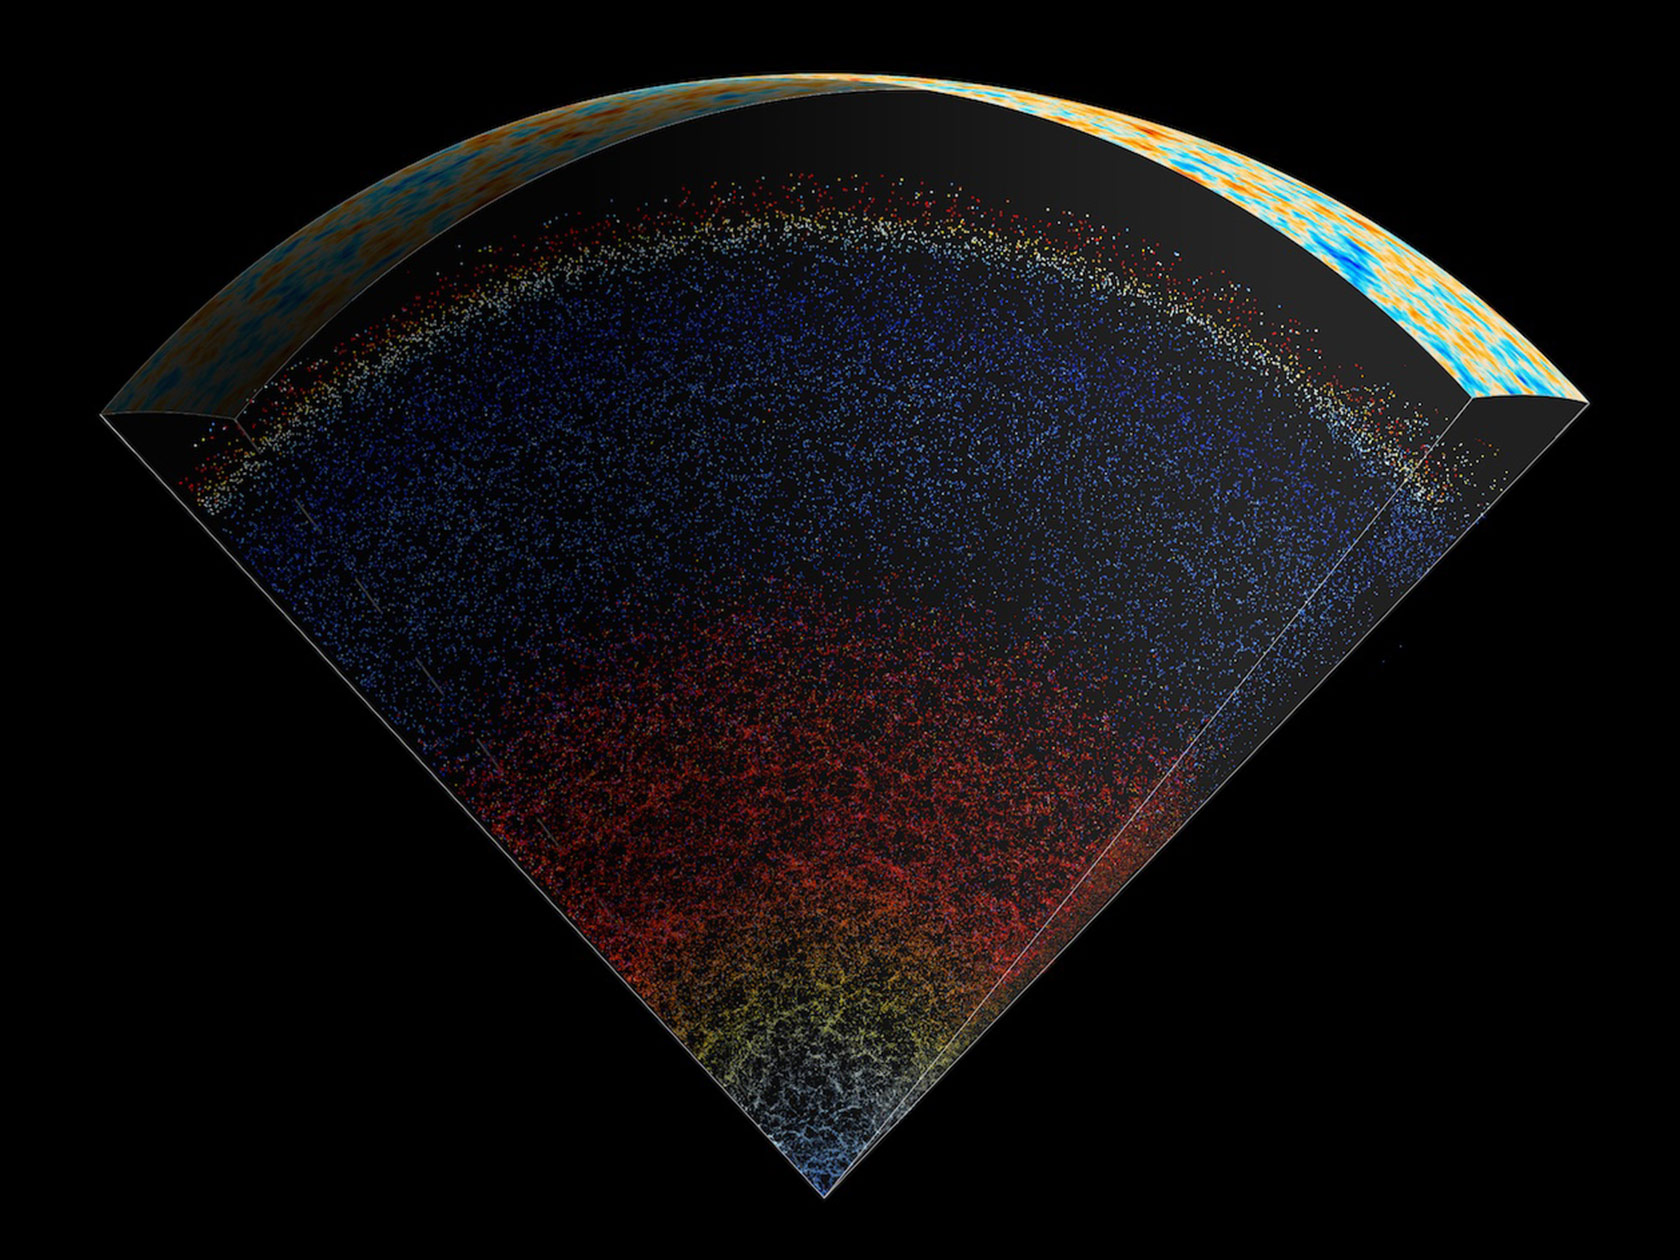
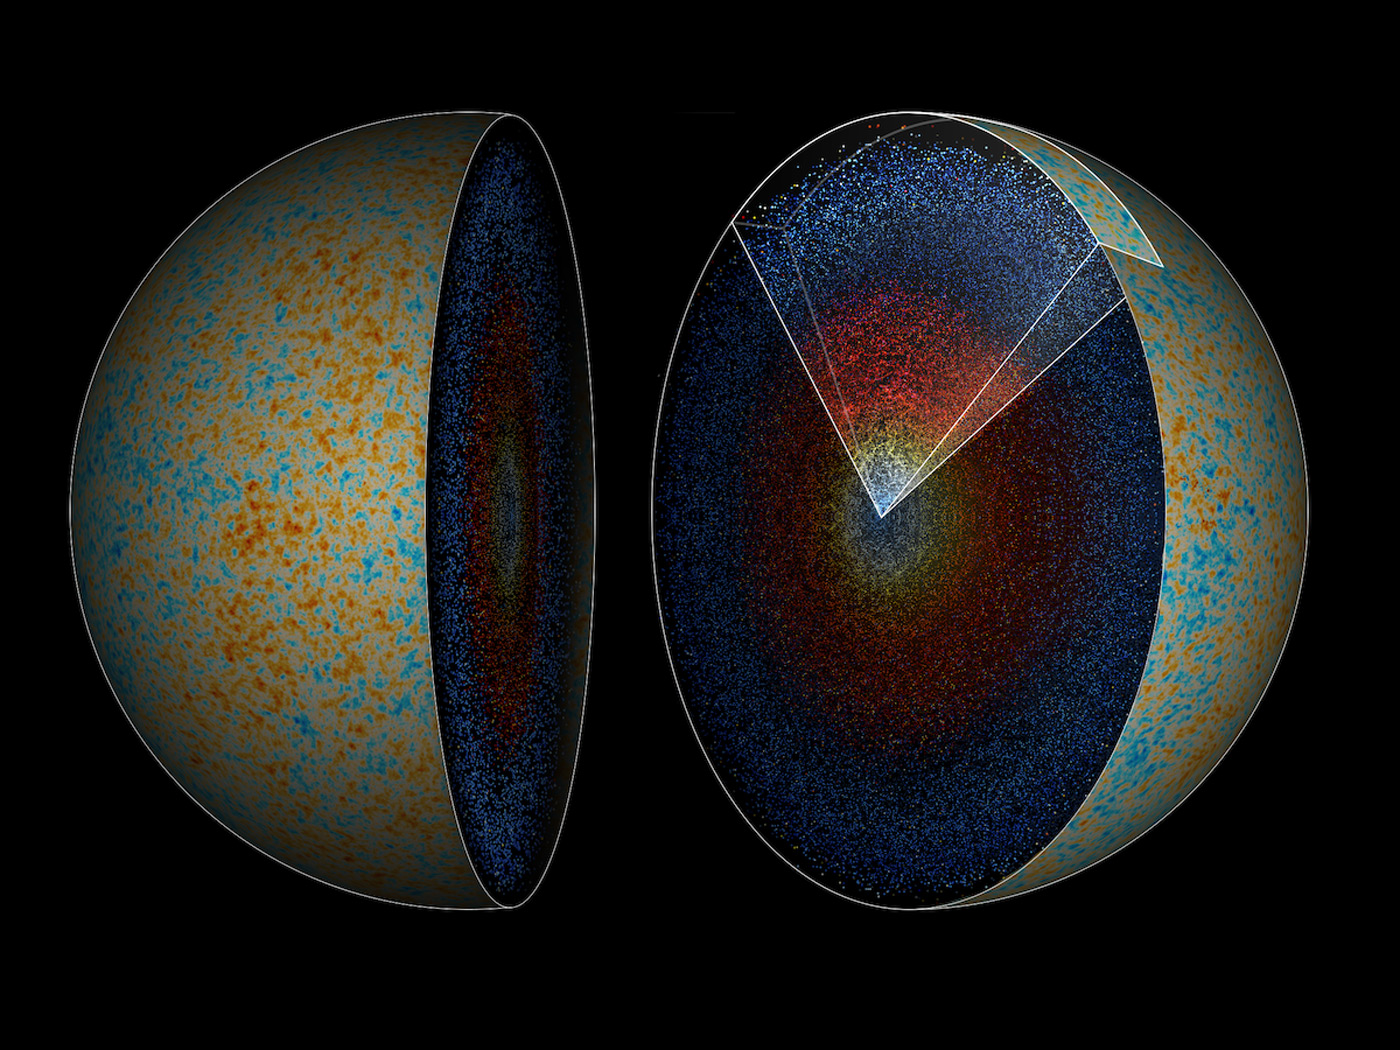
This inquisitive mind appears to be a trait shared between both Nikita and Brice, whose collaboration created “The map of the observable Universe.” As its title suggests, this is a detailed map of our observable Universe, where we are located at the bottom. At the top is the actual edge of the observable Universe and, in between, we see about 200,000 galaxies.
This project treats and organizes over 15 years of astronomical data largely collected from the Sloan Digital Sky Survey. The latter is an ongoing project which began around the year 2000 and that collates astronomical information gathered by a dedicated telescope in New Mexico, USA. This data is frequently utilized in scientific research and discovery but had not been presented to the general public in an accessible visual way until now.
In order to accomplish that, Nikita and Brice had to compile the data pertaining to all the different celestial objects on record, which had been logged separately. This resulted in a massive data set with millions of data points. The main difficulty was, then, in finding ways to visualize such an overwhelming system in a simple way that could be visually digested. “We wanted to invite curiosity without over-explaining and losing the natural beauty. The final map is designed to be an introduction — a beautiful artifact that invites contemplation and further research. We created the website with this same philosophy — rewarding curious visitors with more information and alternative visualizations,” Nikita tells us.
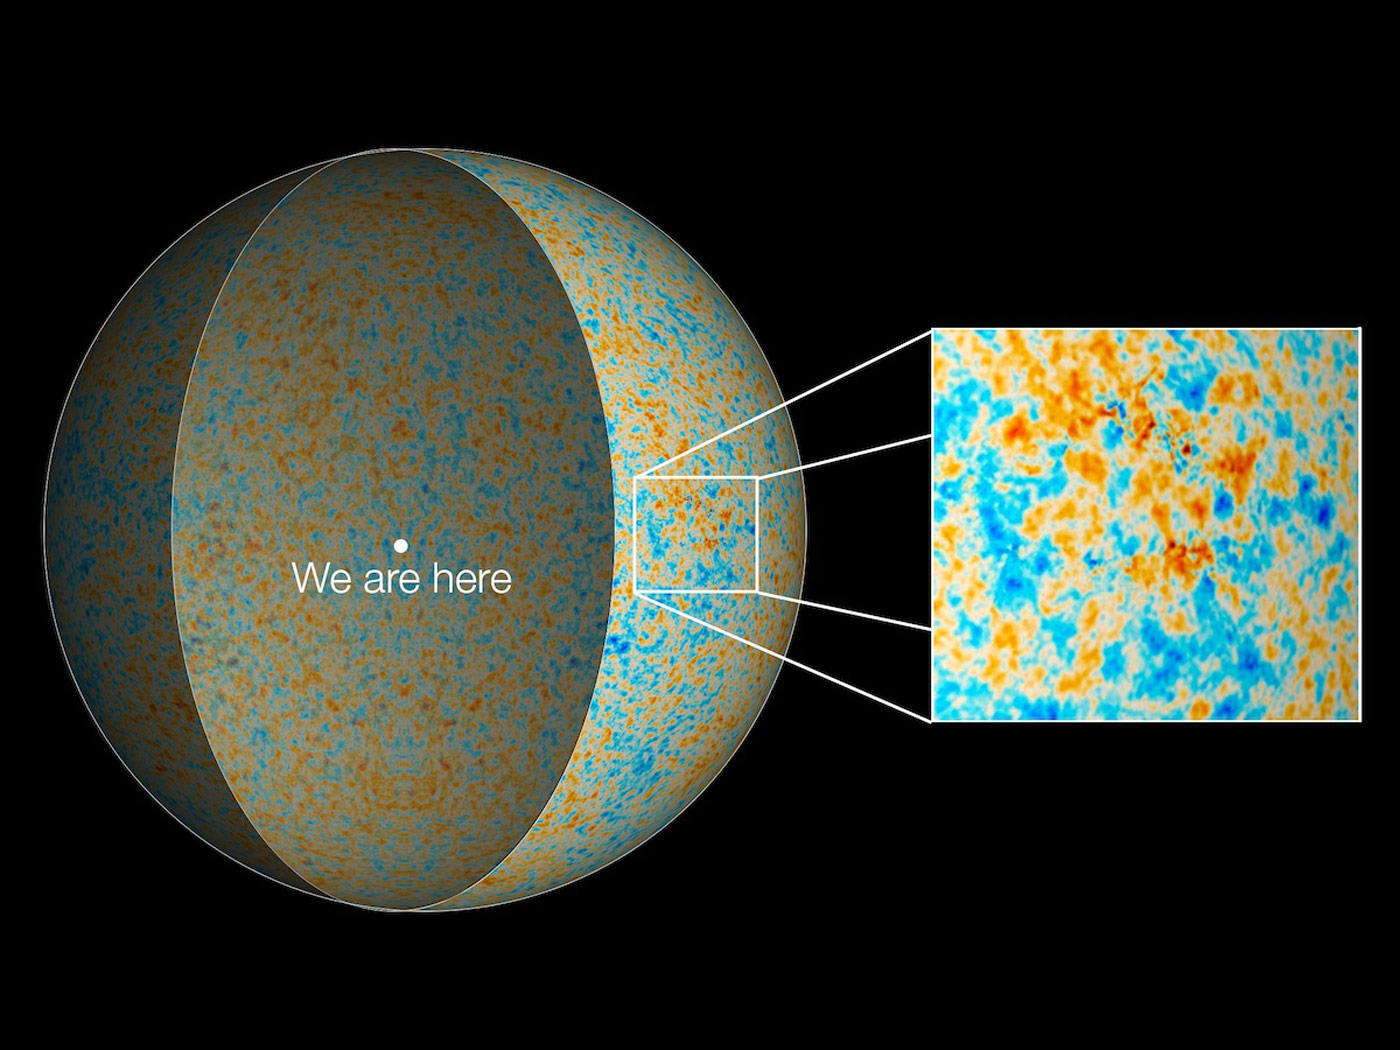
There are, however, several challenges to contend with when working with such astronomical (pun intended) amounts of data. Considering that the order of magnitude we are dealing with is in the millions, it would not be possible to show everything in a single image. A full map of the observable universe would actually be a sphere but there are, quite simply, not enough pixels on the screen. The compromise that Nikita and Brice settled on is a clever one. On a large scale, the Universe is statistically consistent — it has a homogenous texture. So, if we were to slice the Universe, each slice would produce very similar visual textures. Another challenge, which Nikita points out, is how to properly convey the beauty of the Universe’s texture. As he explains, galaxies are organized in massive filamentary structures. 3D projections of these occurrences would saturate the screen, rendering this texture no longer visible, and the map’s beauty lost.
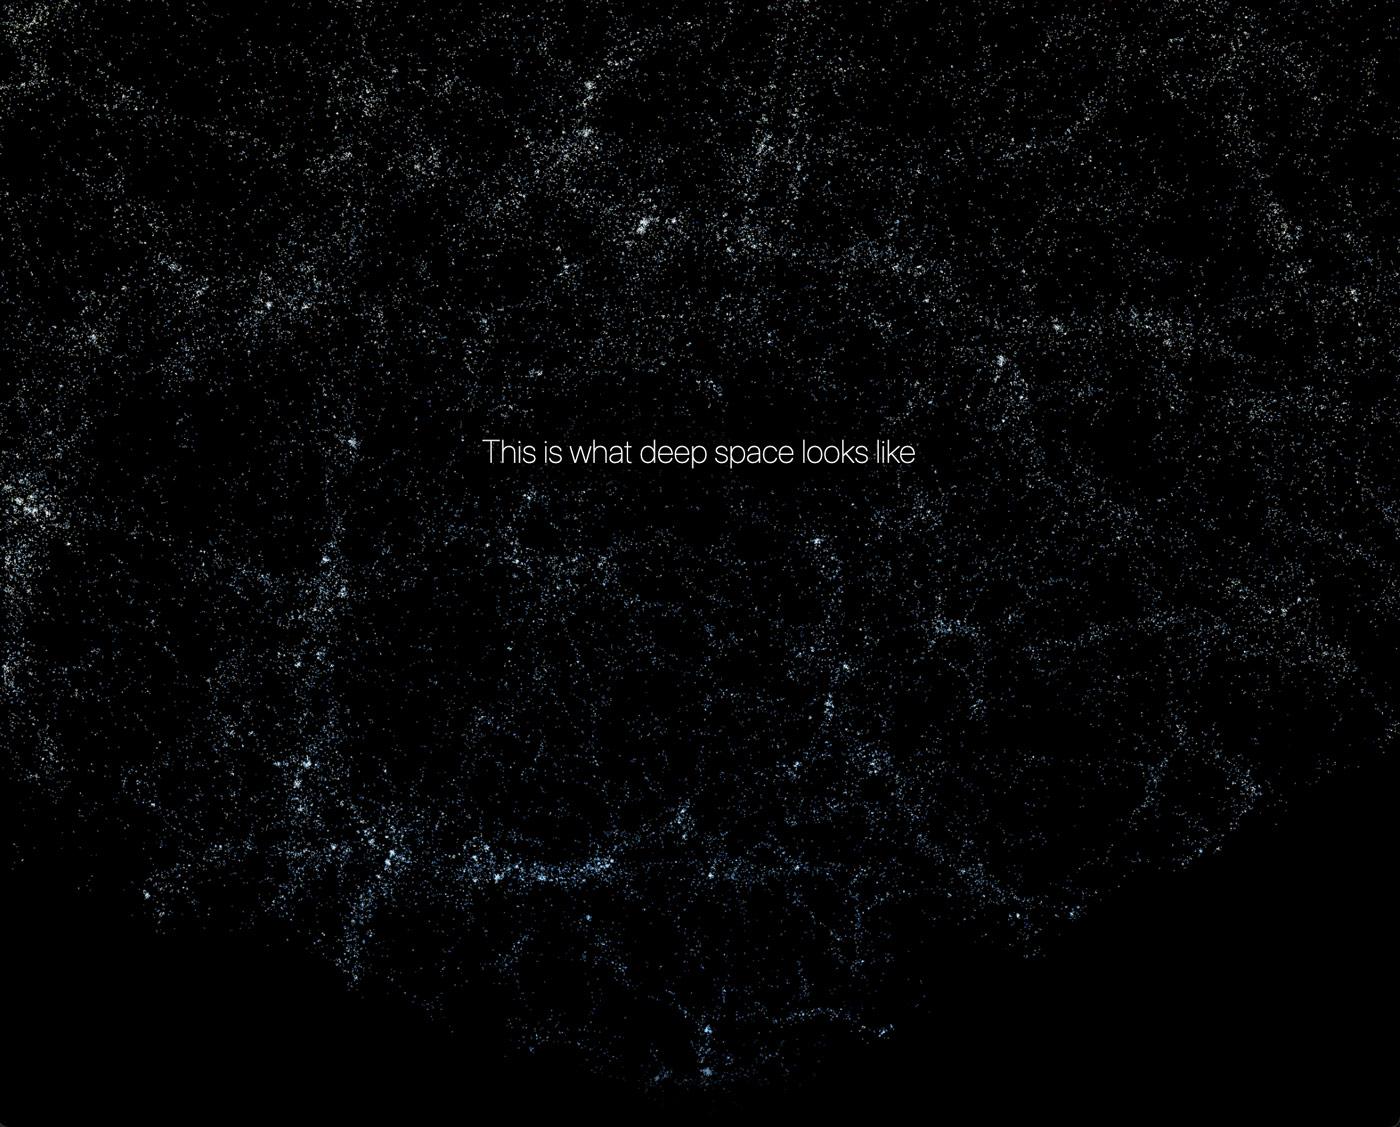
As such, Nikita and Brice’s map shows us only a thin slice of the Universe, with a thickness of about 10º. Finding the optimal balance between the thickness of the slice, the size and brightness of the dots, and the changes in colors and density required some work, adds Nikita. In so doing though, they are able to clearly depict its texture and allow us a full view of the intersecting branches and voids, especially as one engages with the map’s scroll function.
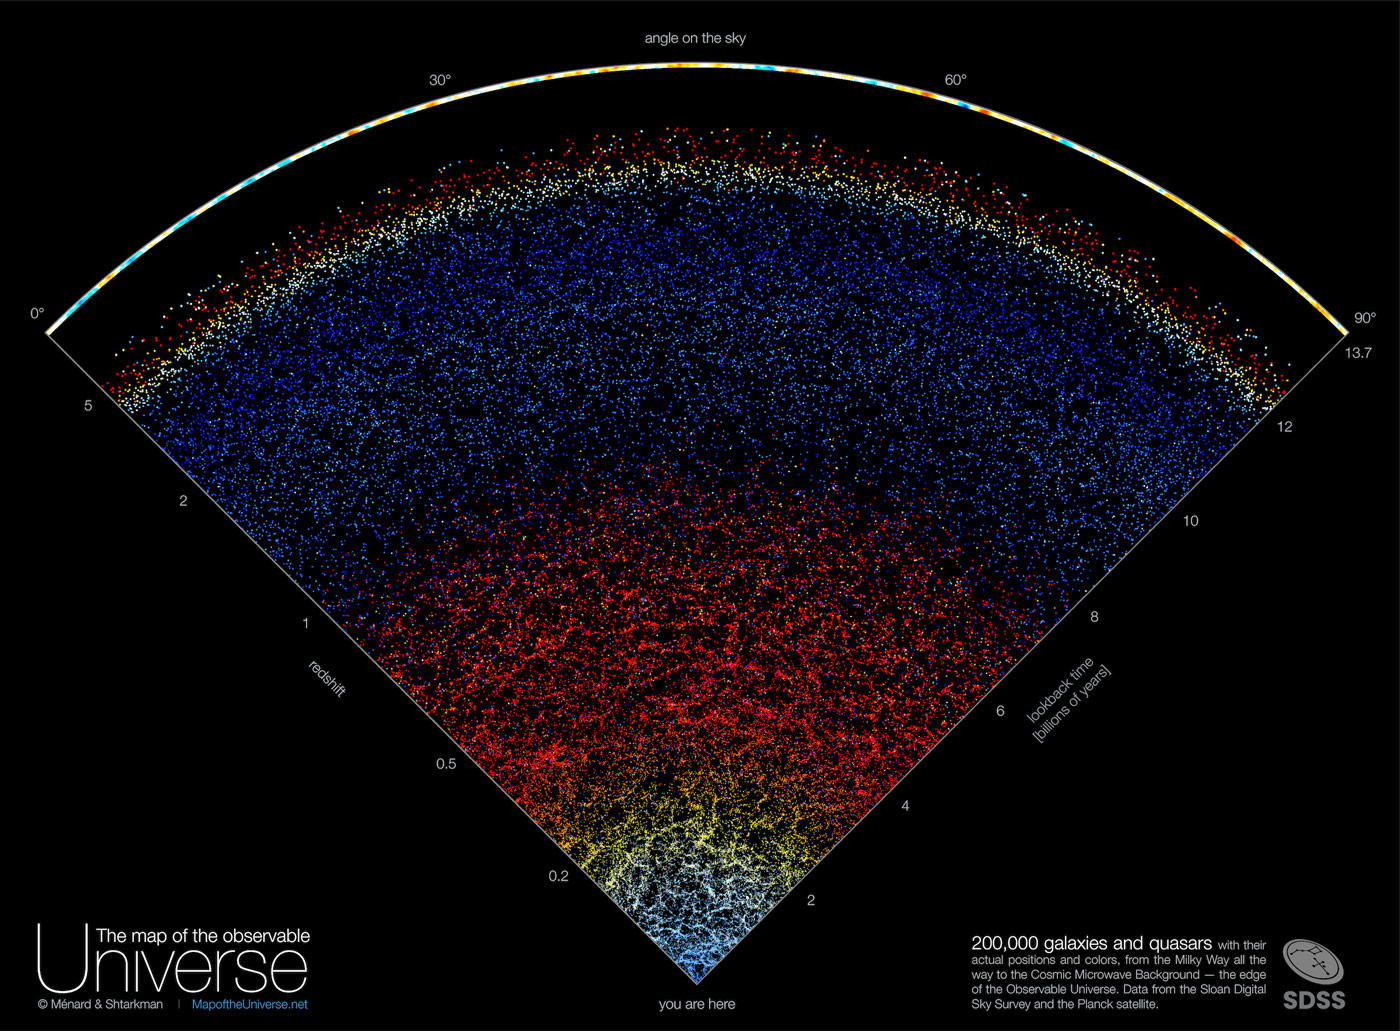
Faced with such vastness, people’s first reaction to the map tends to be a feeling of insignificance, says Nikita. After all, the Milky Way, our whole galaxy, fits into a single pixel. Our entire solar system, our entire planet, our lives, and our loves, all in a single dot, nearly invisible in our immeasurable Universe. But this is part of the inherent beauty in the work that Brice and Nikita undertook, in the attempt to grasp the unfathomable. Indeed, as Brice explains, looking into the Universe is to see backward in time. We don’t perceive this in our daily lives because the human scale is minuscule compared to an entire Universe. But since light travels at a constant speed, it can take some time for it to reach us, and when it has to travel enormous distances at astronomical scales, it can take millions, even billions of years to arrive. This means that anything we observe in the Universe is a snapshot of what it once was. Some of these objects may not even exist anymore.
The farthest we can see is a measure related to the age of the Universe, which astronomers estimate to be around 13 billion years old. This imposes an insurmountable limit to what we have the capacity to perceive — the observable Universe. Even so, we are able to see and comprehend this map. And, as Nikita puts it, his hope is “that the feeling that follows that instinctive first reaction is a deep respect for the capacity of the human spirit.” To be sure, this kind of work is only possible as a boundary-pushing collaborative effort. Between scientists and engineers and designers and programmers, to which both Nikita and Brice attest.
“Working with Brice has been an absolute pleasure,” says Nikita. “I am lucky to get the chance to learn, both from his deep knowledge of astrophysics, and his mastery over complex data sets. With every meeting, I am exposed to some new secret of the universe.” To which Brice adds that “Nikita has all it takes: he is full of ideas, he keeps sketching and exploring new ways to visualize data. It is really thanks to his skills in both computer science and design that the final result has been so successful.”
Indeed, the map, as Nikita tells us, has been very well-received by the public — beyond even their own expectations. “With the release of ‘The map of the observable Universe’,” adds Brice, “I am delighted to share a new type of astronomical image with the world. I hope that this will, in turn, inspire others.” The pair are already working on adding new visuals and new ways to interact with the data. And in the same way, they look forward to their next collaboration, so too can we.

